Frank D. (Tony) Smith, Jr. - 2011 - http://www.valdostamuseum.org/hamsmith/
My
E8
physics
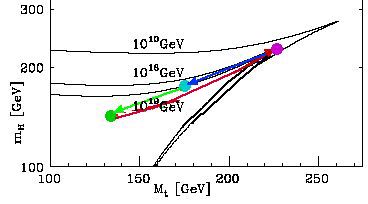
model has 3 states (green,
cyan,
magenta) for the
Higgs-Tquark system:

The low state (green) is in the usual stable-vacuum no-triviality
space-time region.
The middle state (cyan) is on the Triviality boundary where
the Higgs is composite T-Tbar condensate in 8-dim Kaluza-Klein
spacetime with high-energy cut-off scale at the Planck energy 10^19 GeV
which is the lowest of the three Triviality boundary upper
bound
curves.
The high state (magenta) is at the critical point where the
Triviality boundary (upper bound curves) intersects the
vacuum stability boundary (right-side bound curves).

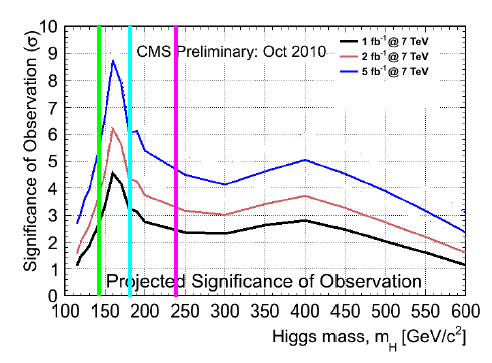
In 1994 a seimileptonic histogram from CDF

seems to me to show all three states of the T-quark.
In 1997 a semileptonic histogram from D0

also seems to me to show all three states of the T-quark.
The fact that the low (green) state showed up in both independent
detectors indicates
a significance of 4 sigma.
Some object that the low (green) state peak should be as wide as the
peak for the middle (cyan) state,
but
my opinion is that the middle (cyan) state should be wide because it is
on the Triviality boundary where the composite nature of the
Higgs as T-Tbar condensate becomes manifest and
the low (green) state should be narrow because it is in the usual
non-trivial region where the T-quark acts more nearly as a single
individual particle.
In 1998 a dilepton histogram from CDF seems to me to show both the low
(green) state and the middle (cyan)
state of the T-quark:
In 1998 an analysis of 14 SLT tagged lepton + 4 jet events by CDF
showed a T-quark mass of 142 GeV (+33,-14) that seems to me to be
consistent with the low (green) state of the T-quark:
In 1997 the Ph.D. thesis of Erich Ward Varnes
(Varnes-fermilab-thesis-1997-28) at page 159 said:
"... distributions for the dilepton candidates. For events with more
than two jets, the dashed curves show the results of considering only
the two highest ET jets in the reconstruction ...
 ..."
(colored bars added by me)
..."
(colored bars added by me)After 1998 until very recently
Fermilab focussed its attention on detailed analysis of the middle
(cyan) T-quark state, getting much valuable detailed information about
it but not producing much information
about the low or high states.
In 2010 the thesis of Viviana
Cavaliere (FERMILAB-THESIS-2010-51) said:
"... We present the measurement of the WW and WZ production cross
section in p pbar collisions
at sqrt(s) = 1.96 TeV, in a final state consisting of an electron
or muon, neutrino and
jets. ...
for the [ 120 , 160 ] GeV/c2 mass
range ... an excess is observed ... corresponding to
a significance of 3.3 sigma
...".
Those results are also presented by her Fermilab collaboration CDF in
arXiv 1104.0699 which says:
"... the invariant mass distribution of jet pairs produced in
association with a W boson using data ... which correspond to an
integrated luminosity of 4.3 fb-1 ...[some image colors altered and
green added
by me]...

... has an excess in the 120-160 GeV/c2 mass range
which is not described by current theoretical predictions ...".
The events corresponding to the middle (cyan) state of the T-quark
are
shown in the left chart as being part of the background, and
after subtracting the background (including the middle (cyan) state)
the right chart shows a Gaussian corresponding to events in the 120-160
GeV /c2 range of the low (green) state of the T-quark.
In arxiv 1104.0699 CDF said
"... we estimate a cross section
times the particle branching ratio
into dijets of the order of 4 pb.
...".
In Fermilab-Pub-11/267-E D0
said
"... The best fit value ... yields a
cross section of ... 0.82 ( +0.83
-0.82 ) pb ...".
Those
cross sections are roughly consistent with a singleT cross
section of 2.90 pb
(see arxiv 1104.4087 by Plehn and Takeuchi).
An objection to Tquark as cause of the excess was raised by Giovanni
Punzi
in slides 31 and 33 of his 2011 Blois Rencontres presentation where he
said said:
"... could this be top background [ arXiv: 1104.4087, arXiv: 1104.3790]
...
the answer is NO - this cannot possibly be top background
- there is no significant tagged component ...".
However,
As to b-tagging, the CDF update on the Wjj bump said:
"... b-tagging in the excess region ... No significant enhancement of
b-tagged events is observed in
the "excess" region compared to the sideband regions. ... This
highlights that ... the excess is not
due to an under-estimated t-tbar content since in these events at least
one of the jets should give rise
to a b-quark in the "excess" region" ...",
so
while lack of tagging might be an argument against t-tbar causing the
excess,
my position is that singleT might cause the excess.
As to b-tagging for singleT, Sullivan and Menon in arxiv 1104.3790
said:
"... one may wonder whether there is a large excess in the 2 b-tag CDF
dijet invariant mass. CDF
has measured that signal in an analysis to search for Higgs production
in WH to Wbbbar. There are
two reasons we do not expect to see a large excess in that study.
First, the deficit in Wbb from tchannel
single-top is almost perfectly cancelled by the excess in the s-channel
single-top
contribution. The basic cuts in the Higgs analysis are almost identical
to the single-top-quark
analysis, and so there is no contamination from processes with
additional jets. Furthermore, in the
CDF Higgs analysis, they normalize their background subtraction to
data. Hence, any residual
excess should be removed. ...".
What
about T-Tbar Events ?
My view is:
most of the T-Tbar events were included in the Tquark background by CDF
in arxiv 1104.0699
but
a few such events may have been faintly seen in a kinematic
distribution plot shown in a link on a CDF note released 2 June 2011 of
the mass of jj+lv (jets, lepton, neutrino) in the 115 to 175 GeV region
of Mjj (colored bars and their description added by me):

The relative lowness of the mid-mid T-Tbar
and mid-low T-Tbar peaks
may be due to CDF inclusion of the mid T in background.