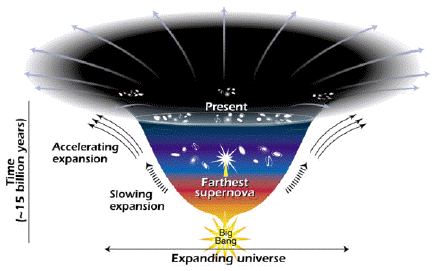

Michael Rowan-Robinson, in astro-ph/0012026, advocates a /\ = 0 model, which is ruled out by Supernova observations. However, his article has useful descriptions of cosmological phenomena, including the Hubble diagram ...[giving an]... estimate for Ho, 63 +/- 6 km/s/Mpc
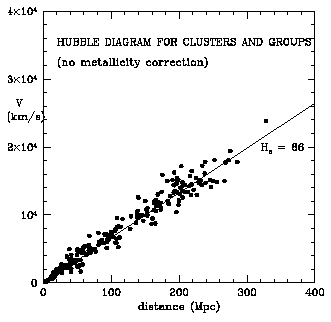
... for OMEGAo = 0.3; /\o = 0.7, the age becomes 15.0 +/- 1.4 Gyr. ...[which].... can be compared with
- the estimate of Chaboyer et al (1998) for the age of the globular clusters, 11.5 +/- 1.3 Gyr,
- to which must be added the time to form the globular clusters, 0.2-2 Gyr, depending on the redshift of formation. ...
... Fig 3 shows the Hubble diagram, velocity versus luminosity distance, for snIa ... filled circles ... , SZ clusters ... open circles ... and gravitational lens time delay systems ... crosses ... .
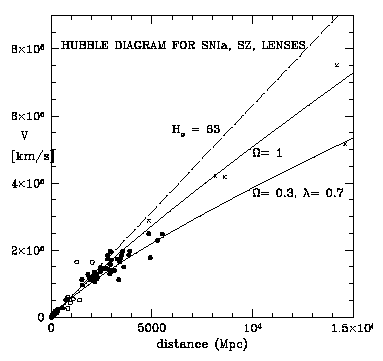
The theoretical curves are shown for an assumed Hubble constant of 63 km/s/Mpc. ...".
A November 2000 analysis of the Cosmic Microwave Background and Cosmic Parameters, ( astro-ph/0011378 ) says:
"... All current CMB data plus a relatively weak prior probability on the Hubble constant, age and LSS points to
both predictions of (non-baroque) inflation theory. ... Table 1. Cosmological parameter values and their 1-sigma errors are shown, determined after marginalizing over the other 6 cosmological and 4 + experimental parameters, for B98+Maxima-I+prior-CMB and the weak prior, 0.45 < h < 0:9, age > 10 Gyr. The LSS prior was also designed to be weak. ... the last line shows the limit on wQ if we allow it to vary (the other parameters do not move much). ... The detections in the table are clearly very stable if extra "prior" probabilities for LSS andSN1 are included, and are also stable with much stronger priors on h, but do move if the BBN-derived 0.019 +/- 0.002 prior is imposed. If OMEGAtot is varied,
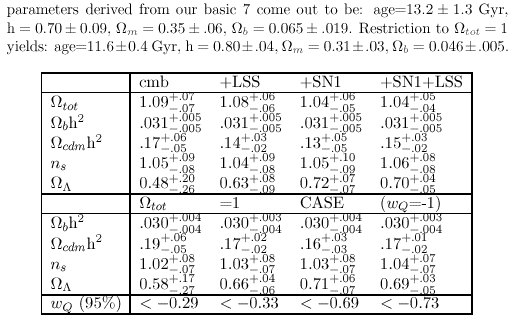
... Though the CDM density is in the expected range ( OMEGAcdm h^2 = 0.17 +/- 0.02 ),
the baryon density OMEGAb h^2 = 0.030 +/- 0.005 is somewhat above the independent 0.019 +/- 0.002 nucleosynthesis estimates.
CMB+LSS gives independent evidence for dark energy ( OMEGA/\ = 0.66 +/- 0.06 ) at the same level as from supernova (SN1) observations, with a phenomenological quintessence equation of state limited by SN1+CMB+LSS to wQ < -0.7 cf .the wQ = -1 cosmological constant case. ...".
In astro-ph/0008057, Evidence from Type Ia Supernovae for an Accelerating Universe, Filippenko and Riess say:
"... SNe Ia are believed to result from the thermonuclear disruption of carbon-oxygen white dwarfs, while SNe II come from core collapse in massive supergiant stars. ...Low-redshift SNe Ia ( z < 0.1 ) demonstrate that the Hubble expansion is linear, that H0 = 65 +/- 2 (statistical) km s^(-1) Mpc^(-1), and that the properties of dust in other galaxies are similar to those of dust in the Milky Way.
We find that the light curves of high-redshift (z = 0.3 to 1) SNe Ia are stretched in a manner consistent with the expansion of space; similarly, their spectra exhibit slower temporal evolution ( by a factor of 1+z ) than those of nearby SNe Ia.
The luminosity distances of our first set of 16 high-redshift SNe Ia are, on average, 10 to 15% farther than expected in a low mass-density ( M = 0.2 ) universe without a cosmological constant. Preliminary analysis of our second set of 9 SNe Ia is consistent with this.
Our work supports models with positive cosmological constant and a current acceleration of the expansion. ... The dynamical age of the Universe is estimated to be 14.2 +/- 1.7 Gyr, consistent with the ages of globular star clusters. ...".
According to a 2 April 2001 article by Robin Lloyd on space.com: "... The Hubble Space Telescope recently captured light from a supernova ... SN1997ff ... located farther from Earth than any previously seen ... 10 billion light-years from Earth. ...
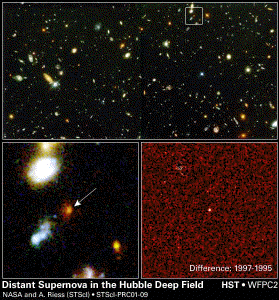
... The team of astronomers, led by Riess, made the discovery by analyzing hundreds of images taken by Hubble in infrared and visible light to study how galaxies formed. Fortuitously, one of the galaxies contained a supernova in Ursa Major previously discovered by astronomers Ron Gilliland of STScI and Mark Phillips of the Carnegie Institutions of Washington. ...[ According to a 4 April 2001 article by David Whitehouse on BBC News Online: "... The ancient stellar detonation was detected by digitally subtracting a before and after image of a faint, yellowish galaxy seen in the now famous Hubble "deep field" image. This difference image shows the supernova ...".]... "The problem was there was only a single measurement of the supernova made when it was discovered," Riess said. "This was not enough to know if this supernova was old, young, at its brightest -- just the information we need to know how bright it is intrinsically and figure out how far away it is." ...
 ...".
...".According to a 2 April 2001 press release from STScI: "... the universe only recently began speeding up, a discovery made about three years ago when the unusually dim light of several distant supernovas suggested the universe is expanding more quickly than in the past, but there were alternate explanations. The more distant supernova [ SN1997ff ] ( redshift z=1.7 ) refutes these alternatives and offers the first ... observational evidence that
According to astro-ph/0011378: "... The Boomerang 150A GHz map (i.e., for one of 16 bolometers) and the multifrequency Wiener-filtered Maxima-I map, its 124 square degrees drawn to scale, are shown ...
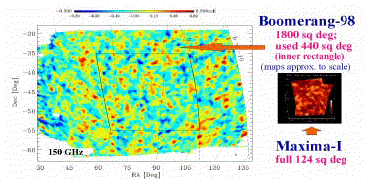
... Only the 440 square degrees within the central rectangle of the entire 1800 square degrees covered by Boomerang were used in the analysis. ...".
Boomerang (balloon observations of millimetric extragalactic radiation and geomagnetics) results reported by de Bernadis et al in Nature 404 (27 April 2000) 955-959 show that "... Tiny inhomogeneities in the early Universe left their imprint on the microwave background in the form of small anisotropies in its temperature. These anisotropies contain information about ... the total energy density and curvature of the Universe. We compute the angular power spectrum of the microwave background, and find a peak at Legendre multipole (I_peak = 197 +/- 6), with an amplitude delta_T _200 = (69 +/- 8) microK. This is consistent with that expected for cold dark matter models in a flat (euclidean) Universe, as favoured by standard inflationary models. ...
... Our data clearly show the presence of power beyond the peak at l =197, corresponding to smaller-scale structures. ...
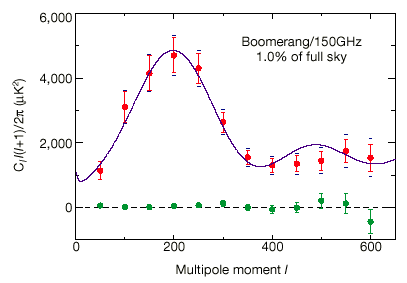
... Each point ... has negligible correlations with the adjacent points. The error bars ... grow at large l due to the signal attenuation ... The current 1 minute uncertainty in the angular resolution of the measurement creates an additional uncertainty - indicated by the distance between the ends of the red error bars and the blue horizontal lines - that is completely correlated and is largest (11%) at l = 600. The green points show the power spectrum of a difference map ... Signals originating from the sky should disappear in this map, so this is a test for contamination in the data ... The solid curve has parameters
= ( 0.05, 0.31, 0.75, 0.95, 0.70 )
It is the best-fit model for the Boomerang test flight data and is shown for comparison only. The model that best fits the new data reported here will be presented elsewhere. ...".
Wayne Hu, in News and Views, Nature 404 (27 April 2000) 939-940, says "... Perhaps the most intriguing aspect of the Boomerang results is the lack of a prominent second peak at half the angular scale of the first. ... [The] ... standard model ... is strongly inconsistent with the observed lack of a prominent second peak in the power spectrum of the cosmic microwave background. ... The key to resolving the mystery of the second peak will be measurements of higher precision and resolution ...".
It seems to me that the second peak is showing up in data from Maxima, and that further data will show that the second peak is really there. See the paper astro-ph/0007333 Cosmology from MAXIMA-1, BOOMERANG & COBE/DMR CMB Observations, which says: "... ¨Analysis of the combined data yields 68% (95%) confidence limits on
These data are consistent with inflationary initial conditions for structure formation. Taken together with other cosmological observations, they imply the existence of both non-baryonic dark matter and dark energy in the universe. ... The B98 and Maxima-1 angular power spectra are shown ...
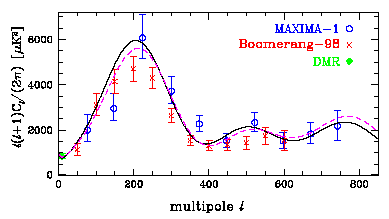
along with some best-fit models. ... the curves show the best fit model in the joint parameter estimation with weak priors [black solid line] and the best fit with OMEGAtot = 1 [magenta dashed line]. ... They remain the best fits when the large scale structure prior is added, and when the SN prior is added the OMEGAtot = 1 model becomes the best fit in both cases. ... Both teams are analyzing additional data which may significantly reduce the errors in the region of the power spectrum where further peaks are expected. ...".
Marc Kamionkowski and Ari Buchalter, in astro-ph/0001045, say: "... Contours of the multipole moment l_2 at which the second peak in the CMB power spectrum occurs. ...
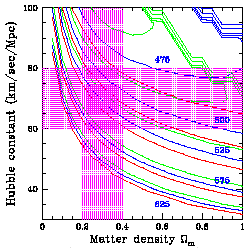
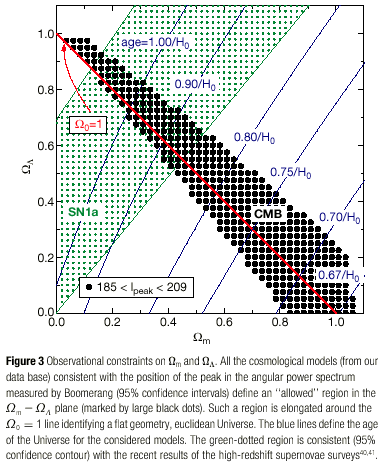
... The heavy solid curves (blue) show contours of l_2 =475, 500, 525, 575, and 625 for the central value, OMEGAb h^2 = 0.019, of the baryon-to-photon ratio. The lower lighter (red) curves and the upper lighter (green) curves show the same for OMEGAb h^2 = 0.015 and OMEGAb h^2 = 0.023, respectively. The horizontal and vertical shaded regions are those allowed, respectively, by HST measurements of the Hubble constant and by supernova results. ...".
The second peak is indeed shown in astro-ph/0104460, A measurement by BOOMERANG of angular power spectrum of multiple peaks in the the cosmic microwave background, by Netterfield et al, who say: "... The "no priors" best fit model ( OMEGA_tot = 1.15; Ho = 42; OMEGA_/\ = 0.7; OMEGA_b h^2 = 0.020; OMEGA_c h 2 = 0.060; to = 20 Gyrs ) fits the central values very well with no calibration or beam shift, but has an unacceptably low value for Ho.
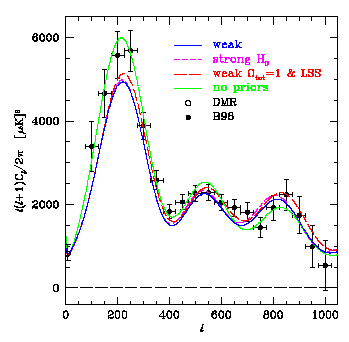
Once the weak priors are invoked, the remaining models take advantage of the uncertainty in calibration and beam size to maintain a good fit. ...".
and
also shown in astro-ph/0104490, COSMOLOGICAL PARAMETER EXTRACTION FROM THE FIRST SEASON OF OBSERVATIONS WITH DASI, by Pryke et al, who say: "... The DASI first-season angular power spectrum in nine bands. The DMR information is shown compressed to the single lowest l [ magenta ] point.
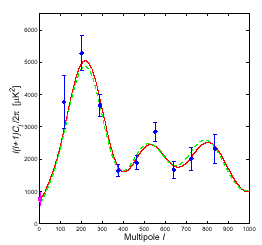
The solid (red) line is the best fitting model which falls on our grid, while the dashed (green) shows the concordance model
= ( 0.05; 0.35; 0.60; 0; 1.00; 0.65 ). ...".
In astro-ph/0007079, Vinod Johri says (with respect to /\CDM cosmology of a cosmological constant /\ with Cold Dark Matter):
"... we regard the universe to be filled up with a mixture of cold dark matter and the vacuum energy represented by the cosmological constant /\ which plays the role of dark energy and tends to accelerate the expansion of the universe. ...cosmic expansion slows down as long as OMEGA_n > 2OMEGA_/\ ( i.e rho_n > 2 rho_/\ ); the clumping of matter into galaxies takes place during this period.
Transition to accelerated expansion occurs when the deceleration parameter q < 0 which corresponds to OMEGA_/\ > 1/3 . It marks the beginning of the /\-dominated phase during which the universe goes on expanding faster and faster and ultimately enters the de Sitter phase of exponential expansion. ...
Since /\ remains constant throughout, ... constraints put theoretical limits on the plausible values of /\.
For instance,the clumping of matter into galaxies can take place during the cosmic deceleration phase (q > 0) when the gravitational attraction is dominant over cosmic repulsion. It follows ... that during the galaxy formation era ... in terms of redshift z with age to of the universe taken as 13 billion years, we get
/\ < 4.2 x 10^(-57) ( 1 + z )^3 Assuming that the galaxy formation continues up to redshift z = 2, we derive the upper limit of /\
/\ < 33.5 x 10^(-57) The transition to accelerated expansion takes place at t = tc corresponding to redshift z = zc ... with q = 0. At the present epoch (z = 0), the cosmic expansion is accelerating (q < 0). This yields the lower limit of /\ as given by
/\ > 4.2 x 10^(-57) ... Taking the observational value ...
/\ = 3 Ho^2 OMEGA_/\ / c^2 = 7.74 x 10^(-57) based on the value of the Hubble constant Ho = 65 km/Mpc/s and OMEGA_/\ = 0:65. ...
... the transition to the accelerating expansion phase in /\CDM cosmology occurs when rho_m = 9.3 x 10(-30) gm/cm^3 which corresponds to zc = 0.54. ...".
In astro-ph/0207286, Odman, Melchiorri, Hobson, and Lasenby say:
"... The recent measurements of the power spectrum of Cosmic Microwave Background anisotropies are in agreement with the simplest inflationary scenario and Big Bang Nucleosynthesis constraints. ... the detection of power around the expected third peak, on arc-minutes scales, provides a new and independent evidence for the presence of non-baryonic dark matter ... The actual data is therefore suggesting that our present cosmological model represents a beautiful and elegant theory able to explain most of the observations ... However, these results rely on the assumption of a class of models based on primordial adiabatic perturbations, cold dark matter and a cosmological constant. ... In the present paper we check to what extent modifications to the standard /\-CDM scenario are needed by current CMB observations with two complementary approaches: First, we provide a model-independent analysis by fitting the actual data with a phenomenological function and characterizing the observed multiple peaks. Phenomenological fits have been extensively used in the past and recent CMB analyses ... Our analysis differs in two ways: we include the new data from the VSA and CBI experiments and we make use of a Monte Carlo Markov Chain (MCMC) algorithm, which allows us to investigate a large number of parameter simultaneously (15 in our case). We then compare the position, relative amplitude and width of the peaks with the same features expected in a 4-parameters model template of /\-CDM spectra. By doing a peak-by-peak comparison between the theory and the phenomenological fit which is based on a much wider set of parameters, we then verify in a systematic way the agreement with the standard theoretical expectations. ...... Using a Monte Carlo Markov Chain approach to Bayesian inference and a low curvature model template we then check for the presence of new physics and/or systematics in the CMB data. We find an almost perfect consistency between the phenomenological fits and the standard /\-CDM models. However, the curvature of the secondary peaks is weakly constrained by the present data. The improved spectral resolution expected from future satellite experiments is clearly warranted for a definitive test of the scenario. ...".

According to an 11 February 2003 Science@NASA web article: "... NASA today released ... A full-sky map of the oldest light in the universe.
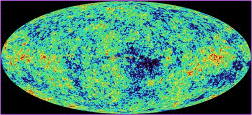
Colors indicate "warmer" (red) and "cooler" (blue) spots. ... One of the biggest surprises revealed in the data is the first generation of stars to shine in the universe first ignited only 200 million years after the big bang, much earlier than many scientists had expected. In addition, the new portrait precisely pegs the age of the universe at 13.7 billion years, with a remarkably small one percent margin of error. The WMAP team found that the big bang and Inflation theories continue to ring true. The contents of the universe include
The light we see today, as the cosmic microwave background, has traveled over 13 billion years to reach us. Within this light are infinitesimal patterns that mark the seeds of what later grew into clusters of galaxies and the vast structure we see all around us today.
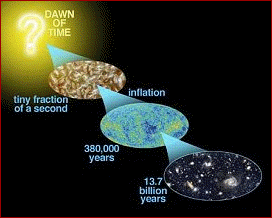
Patterns in the big bang afterglow were frozen in place only 380,000 years after the big bang, a number nailed down by this latest observation. These patterns are tiny temperature differences within this extraordinarily evenly dispersed microwave light bathing the universe, which now averages a frigid 2.73 degrees above absolute zero temperature. WMAP resolves slight temperature fluctuations, which vary by only millionths of a degree. ...
 a million miles from Earth. ... WMAP is named in honor of David
Wilkinson of Princeton University, a ... WMAP team member who died in
September 2002...".
a million miles from Earth. ... WMAP is named in honor of David
Wilkinson of Princeton University, a ... WMAP team member who died in
September 2002...".According to a MAP web page: "... WMAP does not see the light of the first stars directly, but has detected a polarized signal that is the tell-tale signature of the energy released by the first stars. A sequence from a NASA animation.

Frame one depicts temperature fluctuations (shown as color differences) in the oldest light in the universe, as seen today by WMAP. Temperature fluctuations correspond to slight clumping of material in the infant Universe, which ultimately led to the vast structures of galaxies we see today.

Frame two shows matter condensing as gravity pulls matter from regions of lower density to regions of higher density.

Frame three captures the era of the first stars, 200 million years after the Big Bang. Gas has condensed and heated up to temperatures high enough to initiate nuclear fusion, the engine of the stars.

Frame four shows more stars turning on. Galaxies form along those filaments first seen in frame two, a web of structure.

Frame five depicts the modern era, billions upon billions of stars and galaxies... all from the seeds planted in the infant Universe. ...".
According to another MAP web page: "... We have compared and combined the new WMAP data with other diverse cosmic measurements (galaxy clustering, Lyman-alpha cloud clustering, supernovae, etc.), and we have found a new unified understanding of universe:
According to yet another MAP web page: "... If the density of matter and energy in the universe is less than the critical density, then space is open and negatively curved like the surface of a saddle. If the density exactly equals the critical density, then space is flat like a sheet of paper. If the density is greater than critical density, then space is closed and positively curved like the surface of a sphere. In this latter case, light paths diverge and eventually converge back to a point. The Inflationary Theory, an extension of the Big Bang theory, predicts that density is very close to the critical density, producing a flat universe, like a sheet of paper. WMAP has determined, within the limits of instrument error, that the universe is flat. ...".
ordinary matter( according to WMAP - 4% ) - According to a New Scientist (22 March 2003 pp. 41-42) article by Govert Schilling:
"... Only around a quarter (1%) of the baryonic mass is ... in objects we can see ... stars, galaxies, and gas clouds ... Up to another quarter (1%) .. may be ...[in]... objects too faint for our telescopes too pick up, such as burned-out stars, small planets, or stars that failed to ignite ... The lost baryons ...[may be]... strung out like cobwebs throughout the cosmos ...... the Virgo cluster of galaxies ...[is]... beaming out far more extreme-ultraviolet radiation than expected. ...[because]... galaxy clusters ...[are].. filled with gas as hot as 10 million kelvin ...[which]... gives off high-energy X-rays, not lower-energy ultraviolet radiation ... Richard Lieu ... suspected that much cooler gas was being sucked into the galaxy cluster from intergalactic space. ...[if so]... intergalactic space ... is filled with a wispy gas of baryons ...
... Long before galaxies began to form, 3 billion years after the big bang, baryonic matter was spread throughout the universe ... the gas was dominated by hydrogen ... in today's Universe, [some of] the clouds of hydrogen ...[has been]... eaten up during galaxy formation ...
... Computer simulations ... show that ... dark matter ... tends to be ... eventually drawn out into filaments ...[that]... crisscross each other to form a giant cosmic cobweb. ... the densest knots in the web turn into ... congregations of galaxies ... According to Cen and Ostriker's [computer] simulations ... Most of the baryons ... are still in intergalactic space, but ... are too hot to spot easily. ... the process of galaxy formation sends shock waves through intergalactic space, heating the gas to about 1 milion kelvin. ... [the] baryons [are] spread so thinly ... that they cannot transfer heat to each other ...[or]... cool efficiently. ... they .... would beam out low-energy X-rays and extreme-ultraviolet radiation. ...
... theory predicts ... that ... highly ionized oxygen ... produced in the first generation of stars, which later exploded, scattering their contents like confetti throughout the Universe ...[among the lost baryons] ... Tripp and Savage ... found that ... radiation from ... quasars was being absorbed by oxygen ions ... in intergalactic space. ...".
a Cosmological Constant L(t) ( according to WMAP - 73% ).
The ratio 73 : 23 : 4 is only valid NOW, at our present time in the evolution of our Universe. In astro-ph/0207199, Max Tegmark describes that evolution, saying:
"... Space is ... a dynamic entity with curvature, fluctuations and a rich life of its own ... Spectacular new measurements of the cosmic microwave background, gravitational lensing, type Ia supernovae, large-scale structure, spectra of the Lyman alpha forest, stellar dynamics and x-ray binaries are probing the properties of spacetime over 22 orders of magnitude in scale. ......[In the above figure, the]... Solid curve shows the concordance model for the evolution of the cosmic mean density rho(z) proportional to H(z)^2. This curve uniquely characterizes the spacetime expansion history. The horizontal bars indicate the rough redshift ranges over which the various cosmological probes ... are expected to constrain this function. Because the redshift scalings of all density contributions except that of dark energy are believed to be straight lines with known slopes in this plot (power laws), combining into a simple quartic polynomial, an estimate of the dark energy density rho_X(z) can be readily extracted from this curve. Specifically,
- rho is proportional to (1+z)^4 for the cosmic microwave background (CMB) [ which, as a radiation-doominated fluid, has an equation of state p = (1/3) rho, or w = 1/3 ],
- rho is proportional to (1+z)^3 for baryons and cold dark matter,
- rho is proportional to (1+z)^2 for spatial curvature,
- rho is proportional to (1+z)^0 for a cosmological constant and
- rho is proportional to (1+z)^3(1+w) for dark energy with a constant equation of state w.
Measurement errors are for current SN Ia constraints (yellow band) and a forecast for what the SNAP satellite can do (green band), assuming flat space as favored by the CMB. Error bars are for a non-parametric reconstruction with SNAP. ... Current measurements are consistent with an infinite flat everlasting universe containing about
30% cold dark matter,
65% dark energy and
at least two distinct populations of black holes ... Supermassive black holes ... weighing 10^6 - 10^10 solar masses at the centers of ... galaxies ...[and]... Stellar-mass black holes ... weighting [sic] too much to be a white dwarf or a neutron star ( > 3 [solar masses]), and being too faint (often invisible) to be a normal star. ... the similarities between galactic and stellar accretion disk and jet observations are so striking that a single unified explanation seems natural ... There is thus strong evidence for existence of black holes in two separate mass ranges, each making up perhaps 10^(-6) or 10^(-5) of all mass in the universe.
... [other] black holes have been speculated about ... both microscopic ones created in the early universe perhaps making up the dark matter and transient ones constituting "spacetime foam" on the Planck scale ...".
In the D4-D5-E6-E7-E8 VoDou Physics model, Gravity and the Cosmological Constant come from the MacDowell-Mansouri Mechanism and the 15-dimensional Spin(2,4) = SU(2,2) Conformal Group, which is made up of:
According to gr-qc/9809061 by R. Aldrovandi and J. G. Peireira:
"... By the process of Inonu-Wigner group contraction with R -> oo ...[where R ]... the de Sitter pseudo-radius ... , both de Sitter groups ... with metric ... (-1,+1,+1,+1,-1) ...[or]... (-1,+1,+1,+1,+1) ... are reduced to the Poincare group P, and both de Sitter spacetimes are reduced to the Minkowski space M. As the de Sitter scalar curvature goes to zero in this limit, we can say that M is a spacetime gravitationally related to a vanishing cosmological constant.On the other hand, in a similar fashion but taking the limit R -> 0, both de Sitter groups are contracted to the group Q, formed by a semi-direct product between Lorentz and special conformal transformation groups, and both de Sitter spaces are reduced to the cone-space N, which is a space with vanishing Riemann and Ricci curvature tensors. As the scalar curvature of the de Sitter space goes to infinity in this limit, we can say that N is a spacetime gravitationally related to an infinite cosmological constant.
If the fundamental spacetime symmetry of the laws of Physics is that given by the de Sitter instead of the Poincare group, the P-symmetry of the weak cosmological-constant limit and the Q-symmetry of the strong cosmological-constant limit can be considered as limiting cases of the fundamental symmetry.
Minkowski and the cone-space can be considered as dual to each other, in the sense that their geometries are determined respectively by a vanishing and an infinite cosmological constants. The same can be said of their kinematical group of motions: P is associated to a vanishing cosmological constant and Q to an infinite cosmological constant.
The dual transformation connecting these two geometries is the spacetime inversion x^u -> x^u / sigma^2 . Under such a transformation, the Poincare group P is transformed into the group Q, and the Minkowski space M becomes the cone-space N. The points at infinity of M are concentrated in the vertex of the cone-space N, and those on the light-cone of M becomes the infinity of N. It is interesting to notice that, despite presenting an infinite scalar curvature, the concepts of space isotropy and equivalence between inertial frames in the cone-space N are those of special relativity. The difference lies in the concept of uniformity as it is the special conformal transformations, and not ordinary translations, which act transitively on N. ...
... in the light of the recent supernovae results ... favoring possibly quite large values for the cosmological constant, the above results may acquire a further relevance to Cosmology ...".
Since the Cosmological Constant comes from the 10 Rotation, Boost, and Special Conformal generators of the Conformal Group Spin(2,4) = SU(2,2), the fractional part of our Universe of the Cosmological Constant should be about 10 / 15 = 67%.
Since Black Holes, including Dark Matter Primordial Black Holes, are curvature singularities in our 4-dimensional physical spacetime, and since Einstein-Hilbert curvature comes from the 4 Translations of the 15-dimensional Conformal Group Spin(2,4) = SU(2,2) through the MacDowell-Mansouri Mechanism (in which the generators corresponding to the 3 Rotations and 3 Boosts do not propagate), the fractional part of our Universe of Dark Matter Primordial Black Holes should be about 4 / 15 = 27%.
Since Ordinary Matter gets mass from the Higgs mechanism which is related to the 1 Scale Dilatation of the 15-dimensional Conformal Group Spin(2,4) = SU(2,2), the fractional part of our universe of Ordinary Matter should be about 1 / 15 = 6%.
Therefore, our Flat Expanding Universe should, according to the cosmology of the D4-D5-E6-E7-E8 VoDou Physics model, have, roughly:
Some relevant observational results in cosmology are discussed by Subir Sakar in hep-ph/0201140, where he says:
"... The most exciting observational developments have undoubtedly been in measurements of the deceleration parameter q = ( dH^(-1) / dt ) - 1, which equals 0.5 for the E-deS model where H ...[is proportional to]... t^(2/3), and -1 for a DeSitter (deS) model with OMEGA_m = 0, OMEGA_/\ = 1 which has H constant. ... for z > 1 the cosmological constant becomes unimportant relative to the increasing matter density ( ...[proportional to]... (1+z)^3) so the expansion should be seen to be slowing down at such epochs; the transition from acceleration to deceleration occurs at z = ( 2 OMEGA_/\ / OMEGA_m )^(1/3) -1. ......[reference 44 is]... A.G. Riess et al., Astrophys. J. 560 (2001) 49; see also M.S. Turner and A.G. Riess, [astro-ph/0106051]. ...".
According to M.S. Turner and A.G. Riess, in astro-ph/0106051:
"... the SN data favor recent acceleration (z < 0.5) and past deceleration (z > 0.5) ... Specializing to a flat Universe, as indicated by recent CMB anisotropy measurements which determine OMEGA_0 = 1 ± 0.04 ... and constant w_X, these expressions becomeH(z)^2 = H_0^2 [ OMEGA_M (1+z)^3 + OMEGA_X (1+z)^3(1+w_X) ]
q(z) = (1/2) [ ( 1 + (OMEGA_X / OMEGA_M) (1+3w_X) (1+z)^3w_X ) /
/ ( 1 + (OMEGA_X / OMEGA_M) (1+z)^3w_X ) ) ]From this it follows that the redshift of transition from deceleration to acceleration ( = z_(q=0) ) is
1 + z_(q=0) = [ (1+3w_X)( OMEGA_M - 1) / OMEGA_M ]^(-1/(3w_X) ] =
= [ 2 OMEGA_/\ / OMEGA_M ]^(1/3)where the second equation is for vacuum energy (i.e., w_X = -1). ...".
Note that for the /\ Cosmological Constant - Cold Dark Matter - Ordinary Matter model that is favored by WMAP observations and the above calculations, OMEGA_/\ / OMEGA_M = 2 (approximately), so that 1 + z_(q=0) = [ 2 OMEGA_/\ / OMEGA_M ]^(1/3) = 4^(1/3) = 1.587 so that the redshift at the inflection point between decelerated and accelerated expansion is about z_(q=0) = 0.587.
As Dennnis Marks pointed out to me:
the ratio of their overall average densities must vary with time, or scale factor R of our Universe, as it expands so that the above calculated ratio 0.67 : 0.27 : 0.06 is valid only for a particular time, or scale factor, of our Universe, and that is a time near our present time at which WMAP measures that ratio to be 0.73 : 0.23 : 0.04 (in my opinion very close to the above caculated ratio). His remarks are substantially equivalent to a question that Michael S. Turner, in astro-ph/0202005, calls "... The Nancy Kerrigan Problem ... in the past dark energy was unimportant and in the future it will be dominant! We just happen to live at the time when dark matter and dark energy have comparable densities. In the words of Olympic skater Nancy Kerrigan, "Why me? Why now?". In other words:
Since WMAP observes Ordinary Matter at 4% NOW, the time WHEN Ordinary Matter was 6% would be at redshift z such that 1 / (1+z)^3 = 0.04 / 0.06 = 2/3 , or (1+z)^3 = 1.5 , or 1+z = 1.145 , or z = 0.145. To translate redshift into time, in billions of years before present, or Gy BP, use this chart
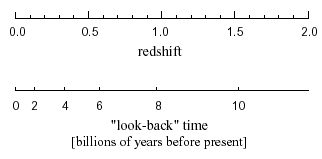
from a www.supernova.lbl.gov file SNAPoverview.pdf. to see that the time WHEN Ordinary Matter was 6% would have been a bit over 2 billion years ago, or 2 Gy BP.
If Cold Dark Matter = Primordial Black Holes (PBH):
The above calculation of 2 Gy BP for the ratio 0.67 : 0.27 : 0.06 is based only on the decline in the Ordinary Matter component with expansion of Space, so it is only a rough estimate, in that it ignores such things as decay of Ordinary Matter protons by GUT (10^31 year lifetime) or by Black Hole processes (10^64 year lifetime), which would be less important during the relevant time periods near NOW than in the Black Hole and Dark Eras of the distant future.
Jack Sarfatti said (in the context of his physics/cosmology model): "... "... I am also saying that lepto-quarks [leptons and quarks] have dark matter cores on small scale. It's /\zpf < 0 that keeps electron stable. Think, naively for the nonce, of electron as a shell of electric charge with an inner /\zpf < 0 core. It looks like a "point" from huge effective curvature of /\zpf. ...".That idea is not only interestingly similar to the idea of /\zpf < 0 haloes helping to hold galaxies together, but also seems very much like the Compton Radius Vortex model of leptons and quarks as Kerr-Newman black holes with no cosmic censorship of their naked singularities.
Also, perhaps the concept of Primordial Black Holes as Cold Dark Matter might be a particle manifestation of the part of /\zpf < 0 (or, perhaps equivalently, MOND Cold Dark Matter) that is not found in the center of /\ = 0 Ordinary Matter leptons and quarks. If that viewpoint is correct, in view of the WMAP ratio of 73% - 23% - 4% of /\ > 0 , /\ < 0, /\ = 0, there should be a lot more mass in /\ < 0 Primordial Black Holes than in /\ = 0 leptons and quarks.
Further, Cold Dark Matter cores of leptons and quarks seems consistent with an association of Ordinary Matter with production of MOND Cold Dark Matter in early times of our Universe, and it may be that PBH Cold Dark Matter and MOND Cold Dark Matter may be very closely related.
As to how the Dark Energy /\ and Cold Dark Matter terms have evolved during the past 2 Gy, a rough estimate analysis would be, if Cold Dark matter = PBH:
The Ordinary Matter excess 0.06 - 0.04 = 0.02 plus the first-order CDM excess 0.27 - 0.18 = 0.09 should be summed to get a total first-order excess of 0.11, which in turn should be distributed to the /\ and CDM factors in their natural ratio 67 : 27, producing, for NOW after 2 Gy of expansion:
so that the present ratio of 0.73 : 0.23 : 0.04 observed by WMAP seems to me to be consistent with the cosmology of the D4-D5-E6-E7-E8 VoDou Physics model if Cold Dark Matter = PBH.
( Note that the equation of state for MOND might be similar to that for gravitational interactions from other Worlds of the Many-Worlds, so, in these calculations, MOND dark matter might be taken to include gravitational interactions from other Worlds of the Many-Worlds. )
The above calculation of 2 Gy BP for the ratio 0.67 : 0.27 : 0.06 is based only on the decline in the Ordinary Matter component with expansion of Space, so it is only a rough estimate, in that it ignores such things as decay of Ordinary Matter protons by GUT (10^31 year lifetime) or by Black Hole processes (10^64 year lifetime), which would be less important during the relevant time periods near NOW than in the Black Hole and Dark Eras of the distant future.
At first glance it might appear that if MOND obeys an equation of state with w = -1 similar to /\, as opposed to w = 0 similar to Ordinary matter, then MOND could not be the CDM of our Universe because, as Max Tegmark says: "... rho is proportional to (1+z)^3 for baryons and cold dark matter ...", while rho is constant if w = -1. However, Jack Sarfatti has suggested (in the context of his physics/cosmology model) that "... the galactic halos are huge spheres of exotic vacuum ...[ /\ < 0 Cold Dark Matter]... keeping the galaxies stable ...".If Cold Dark Matter is concentrated around galaxies, then maybe Cosmological Constant /\ > 0 Dark Energy energy is concentrated in the (now much larger) volume of space that is mostly empty vacuum and maybe the reason for them to be located in different parts of our universe is that:
- Dark Stuff in empty space naturally has the full Conformal Degrees of Freedom of Cosmological Constant /\ > 0 Dark Energy, so that the local background spacetime is a conformal cone-space; but
- Dark Stuff in the presence of the gravitational field of ordinary matter (such as in galactic haloes) becomes MOND Cold Dark Matter, loses full Conformal Degrees of Freedom, and is reduced to the degrees of freedom of the Poincare group with Minkowski spacetime as local background.
As to how that would affect the evolution of MOND Cold Dark Matter:
- in the distant past, when Ordinary Matter was far more abundant than Cosmological Constant /\ > 0 Dark Energy, the MOND Cold Dark Matter may have been mostly generated by, and therefore proportional by 27 / 6 to, the gravitational field of Ordinary Matter. Therefore, at early times, MOND Cold Dark Matter would have its effective equation of state derived from that of ordinary matter, evolving consistently with the early universe asymptote (1+z)^3 shown on the Tegmark figure; while
- in the near present and the future, Cosmological Constant /\ > 0 Dark Energy dominates Ordinary Matter, and the rate of creation of MOND Cold Dark Matter will be proportional by 27 / 67 to Cosmological Constant /\ > 0 Dark Energy, although the MOND Cold Dark Matter will tend to fall into, and be concentrated near, Ordinary Matter such as is found in the galaxies of our universe.
In his physics/cosmology model, Jack Sarfatti describes Dark Matter as a gravitationally attractive exotic form of Dark Energy equivalent to a Cosmological Constant taking values /\ < 0, while he describes Ordinary Matter as corresponding to non-exotic /\ = 0 with equilibrium vaccuum fluctuations producing Born Rule quantum phenomena, and Dark Energy as corresponding to an anti-gravitating conventional Cosmological Constant with /\ > 0.
It may be that Jack Sarfatti's /\ < 0 Dark Matter may be substantially equivalent to my MOND Cold Dark Matter, and
it may also be that MOND Cold Dark Matter and PBH Cold Dark Matter may be very closely related.
As to how the Dark Energy /\ and Cold Dark Matter terms have evolved during the past 2 Gy and will evolve during the future, times for which /\ dominates Ordinary Matter, a rough estimate analysis would be, if Cold Dark Matter = MOND:
The Ordinary Matter excess 0.06 - 0.04 = 0.02 should be distributed to the /\ and CDM factors in their natural ratio 67 : 27, producing, for NOW after 2 Gy of expansion:
so that the present ratio of 0.73 : 0.23 : 0.04 observed by WMAP seems to me to be roughly consistent with the cosmology of the D4-D5-E6-E7-E8 VoDou Physics model if Cold Dark Matter = MOND, although the correspondence is not quite as close as for the case that Cold Dark Matter = PBH.
( Note that the equation of state for MOND might be similar to that for gravitational interactions from other Worlds of the Many-Worlds, so, in these calculations, MOND dark matter might be taken to include gravitational interactions from other Worlds of the Many-Worlds. )
The above calculation of 2 Gy BP for the ratio 0.67 : 0.27 : 0.06 is based only on the decline in the Ordinary Matter component with expansion of Space, so it is only a rough estimate, in that it ignores such things as decay of Ordinary Matter protons by GUT (10^31 year lifetime) or by Black Hole processes (10^64 year lifetime), which would be less important during the relevant time periods near NOW than in the Black Hole and Dark Eras of the distant future. As to how the Dark Energy /\ and Cold Dark Matter terms have evolved during the past 2 Gy, and will evolve during the future, times for which /\ dominates Ordinary Matter, a rough estimate analysis would be, if Cold Dark Matter = (1/2) PBH + (1/2) MOND:
The Ordinary Matter excess 0.06 - 0.04 = 0.02 plus the first-order CDM excess 0.13 = 0.09 = 0.04 should be summed to get a total first-order excess of 0.06, which in turn should be distributed to the /\ and CDM factors in their natural ratio 67 : 27, producing, for NOW after 2 Gy of expansion:
so that the present ratio of 0.73 : 0.23 : 0.04 observed by WMAP seems to me to be quite consistent with the cosmology of the D4-D5-E6-E7-E8 VoDou Physics model if Cold Dark Matter = PBH + MOND.
In my opinion, there are four Special Times in the history of our Universe:
After the Last Intersection at the end of the Early Part of the Accelerating Expansion of our Universe, expansion of our Universe continues to accelerate with the Late Part of its Accelerating Expansion until New Universes are created by Quantum Fluctuation Black Holes. New Universe creation can happen many times at many Times (almost all of which are late).
Those four Special Times define four Special Epochs:
NOW happens to be about 2 billion years into the Late Accelerating Expansion Epoch.
Our present insight that the Time of Life on Earth, from the Proterozoic begining of Eukaryotic Life to Present-Day Humanity, covers the 2 billion years beginning with a Special Time in the Time-History of our Universe leads us to a better understanding of the Unification of Gravity / Particle Physics / Mathematics / Information / Consciousness, and perhaps to a better understanding our our ultimate Fate.
Therefore:
and
It is interesting to compare the Special Time of the calculated ratio 0.67 : 0.27 : 0.06 with the D4-E5-E6-E7-E8 VoDou Physics model calculations of particle masses and force strength constants, because
For example, calculation of the QCD color force strength gives the number 0.6286, but that is only valid at the energy level of /\qcd = 245 MeV. To get the QCD force strength that you see around the W mass of about 91 GeV, you have to run the QCD force strength by renormalization equations, which, on a simple level, give a QCD force strength of about 0.106 at 91 GeV, which in my opinion may be a reasonably physically realistic result.
To the extent that its Spacetime expands more rapidly than a standard Friedman universe, the Inflationary Era of the Universe has an effective Cosmological Constant L(t) that causes particle creation (qualitatively somewhat similarly to the C-field of Hoyle's Steady-State cosmology).
During the life of our universe,
another Inflationary Universe might form from a Quantum Fluctuation.
The Dipole is the dominant part of the Cosmic Microwave Background Radiation:
According to an MIT web page:
"... [This] map ...
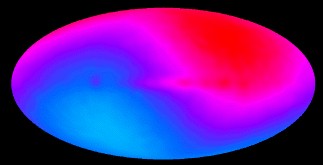
... includes the dipole (due to the motion of the Earth, Solar System, and Galaxy through the universe) and Galaxy. ...
...[From this]... map ...
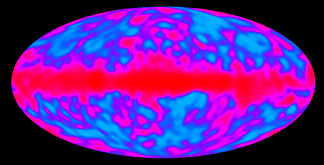
... the dipole has been subtracted ...
...[From this]... map ...
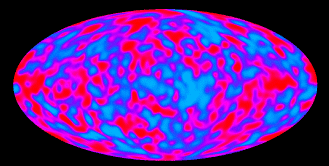
... both the dipole and the Galaxy have been subtracted ... Most of what is left is receiver noise, but a careful statistacal analysis is able to ... extract the cosmic signal on large angular scales ...". According to an 8 March 1997 Astronomy Picture of the Day web page, "... The map indicates that the Local Group moves at about 600 kilometers per second relative to this primordial radiation. ...". According to an NCSA web page, "... our entire Local Group [of galaxies, including M31 in Andromeda] is hurtling toward the center of the Virgo cluster at one million miles per hour. The Virgo cluster lies some 50 million light years from Earth. ... the Virgo Cluster, along with several other large clusters, are in turn speeding towards a gigantic unseen mass named The Great Attractor. ...".
According to a 3 March 2003 BBC article by David Whitehouse, "... Max Tegmark, of the University of Pennsylvania, US, ... and colleagues present the CMB as a sphere [Galactic Northern hemisphere shown in the image below]: ...
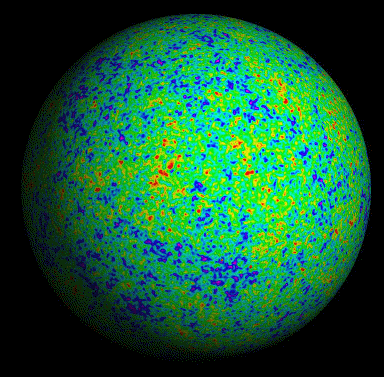
... "The entire observable Universe is inside this sphere, with us at the centre of it." ... "Space continues outside the sphere but this opaque glowing wall of hydrogen plasma hides it from our view. If we could only see another 380,000 light-years we would be able to see the beginning of the Universe," ...".
Tegmark, de Oliveira-Costa, and Hamilton say, in astro-ph/0302496, "... We perform an independent foreground analysis of the WMAP maps to produce a cleaned CMB map ... ... We also produce a Wiener filtered CMB map, representing our best guess as to what the CMB sky actually looks like ... we plot the lowest three multipoles of our cleaned map ... all on the same temperature scale ...
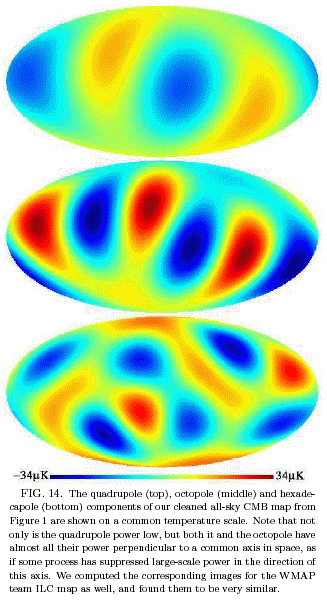
... First of all, although a generic quadrupole has six lobes (three orthogonal pairs of lobes, each of which is either both hot or both cold), we see that the actual CMB quadrupole has only four nonnegligible lobes, and that the two cold lobes, apparently coincidentally, fall near the Galactic plane. Applying a Galaxy cut therefore removes a substantial fraction of the quadrupole power. In other words, there is a preferred axis in space along which the quadrupole has almost no power. This axis is roughly the line connecting us with (l, b) = (-80, 60) in Virgo. ...
[ According to a WMAP paper astro-ph/0302207: "... The angular power spectrum is shown for the WMAP data ...... The WMAP power spectrum agrees closely with COBE at the largest angular scales, and with CBI and ACBAR at the finer angular scales. ... /\CDM models predict enhanced large angle power due to the integrated Sachs-Wolfe effect. The WMAP and COBE data, on the other hand, have the opposite trend. ... The quadrupole is the l = 2 term of the spectrum delta T_l^2 ... The quadrupole value is low compared with values predicted by /\CDM models that fit the rest of the power spectrum. /\CDM models, in particular, tend to predict relatively high quadrupole values due to the enhanced, /\-driven, integrated Sachs-Wolfe effect. ...". ] [ According to Principles of Physical Cosmology, by P. J. E. Peebles (Princeton 1993, at pp. 500-501): "... Sachs and Wolfe ... showed [in 1967] that in the standard cosmological model the large-scale fluctuations in the cosmic background radiation temperature as a function of position across the sky provide a sensitive measure of large-scale fluctuations in the mass distribution. ... the CBR temperature scales inversely with the redshift along the line of sight to last scattering, and the redshift is proportional to the expansion factor along the line of sight. If large-scale departures from homogeneity caused the expansion of the universe across the Hubble length to differ by the fractional amount d_h, measured in orthogonal directions, it would produce a quadrupole CBR anomaly dT / T = d_h. ... the constraint on d_h from the Sachs-Wolfe relation decreases with decreasing scale ...". ]
[ According to a 5 April 2003 article by Michael Brooks in the New Scientist (pages 22-23): "... David Spergel ... says ... When the ... Square of temperature difference (microkelvins^2) [in the above figure] ... are compared across the largest distance scales, the WMAP data falls below the theoretical prediction ... The mismatch ... is disturbing ... because it suggests there could be something fundamentally different about the Universe on the largest size scales. ...". ]
[ Perhaps those low WMAP values are due to the preferred axis along the line connecting us with (l,b) = (-80,60) in Virgo, or to large-scale regions outside Gravitationally Bound Domains of Unispace. ]
... Second, although the overall octopole power is large, not suppressed like the quadrupole, it too displays the unusual property of a preferred axis along which poweris suppressed. Moreover, this [octopole] axis is seen to be approximately aligned with that for the quadrupole. The reason that our measured octopole ... is larger than that reported by the WMAP team is therefore, once again, that much of the power falls within the Galaxy cut. In contrast, the hexadecapole is seen to exhibit the more generic behavior we expect of an isotropic random field, with no obvious preferred axis. ...
... We thank the the WMAP team for producing such a superb data set and for promptly making it public ...".
Note that dipole (line segment) configurations
*---*
are naturally related to spatial axes in 3-dimensional space, as are quadrupole (square) and octopole (cube) configurations
*---*          *---*
|   |          |\  |\
*---*          *-*-*-*
                \| \ |
                 *---*
However, since higher multipoles, from hexadecapole on up, are related to 4-dimensional and higher dimensional hypercubes, they do not have such a direct relationship to spatial axes in 3-dimensional space. Galactic coordinates for the dipole
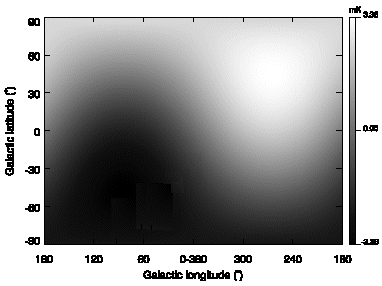
are shown in astro-ph/0110650 by Piat, Lagache, Bernard, Giard, and Puget. It seems to me that the dipole, the quadrupole and the octopole are all aligned with respect to the same axis, which corresponds to the Great Attractor in Virgo. Therefore, I think that:
In 1995, Di Nella and Paturel at Lyon
observed that "The distribution of galaxies up
to a distance of 200 Mpc (650 million light-years) is flat and
shows a structure like a shell roughly centered on the
Local Supercluster (Virgo cluster). This result clearly
confirms the existence of the hypergalactic large scale
structure noted in 1988."

Woudt, Fairall, and Kraan-Korteweg said in 1996
that the core of the Great Attractor may be located
behind the Southern Milky Way,
dominated by the cluster ACO 3627
at redshift distance 4882 km/sec.

The Coma cluster of the northern Great Wall,
at redshift distance 6960 km/sec, is another large structure.

In 1997 Charles Steidel of Caltech (Science 276 (4 April 1997) 36)
observed walls of galaxies hundreds of millions of light years long
at redshifts between 2.8 and 3.5, only 2 billion years after the Big Bang.

Subir Sakar has done a computer analysis of data
from the Anglo-Australian Automatic Plate Measuring suvey
and found Galactic Clusters on the scale of 300 million light years
(New Scientist article by Marcus Chown, 25 April 1998, page 7).
......