Tommaso Dorigo, in his blog entry "New Higgs predictions from EW fits: M(h)=80 GeV!" said, on 19 January 2007:
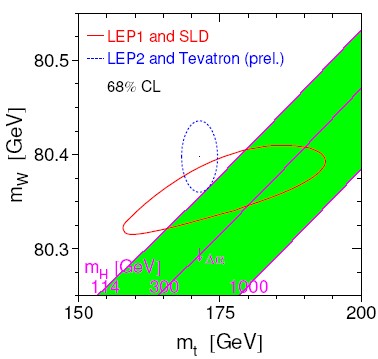
"... An improved version of the Mw-Mt plot has been produced for winter conferences. I am still unaware of the numbers entering in this new global fit, but here is the January 2007 result anyhow: the most likely higgs mass sits at 80 GeV, with an uncertainty of +36-26 GeV. This supersedes the former result of 85+39-28 GeV.
The plot shows the dependence between the W mass and the top quark mass in the Standard Model, as a function of the unknown mass of the Higgs. Lines belonging to the green band represent the functional dependence between W and top mass for a fixed value of Higgs mass. The red ellipse constrains the three particle masses using electroweak measurements at LEP and SLD, while the blue ellipse encrypts all direct measurements of the top and W masses. The fact that the intersection between the blue ellipse and the red one is very small, and does not include any green region, implies that there is a tension between the lower limit on the Higgs mass obtained at LEP II (114 GeV) and the favored higgs mass, now at 80 GeV and thus about one sigma away from the allowed region.
This is becoming a story of the incredibly shrinking higgs. But wait until my team blesses an improved jet energy scale measurement in CDF, using the Z->bb peak: I expect it to change things a bit, since most of CDF top quark mass determinations will be affected. If the authors of the analyses include the new scale measurement into their results, that is. ...".
I [Tony Smith] commented on 23 January 2007:
"... Tommaso said
"… here is the January 2007 result anyhow: the most likely higgs mass sits at 80 GeV, with an uncertainty of +36-26 GeV…there is a tension between the lower limit on the Higgs mass obtained at LEP II (114 GeV) and the favored higgs mass, now at 80 GeV and thus about one sigma away from the allowed region. …".
Although one sigma is far from enough to say that the Electroweak Standard Model is refuted by LEP II HIggs search, it does raise the question:
If the Higgs is really at least 114 GeV, then what parts of the Electroweak Standard Model are most likely to be changed in making the global fit to data match the experimental Higgs mass.
According to the 2006 PDG review "10. Electroweak Model …" revised September 2005 by Erler and Langacker:
"… The global fit to all data, including the CDF/D0 average, m_t = 172.7 +/- 3.0 GeV, yields M_H = 89 +38 -28 GeV …the goodness of the fit to all data is very good … Only g_L^2 from NuTeV and A^(0,b)_FB from LEP are currently showing large (2.7 sigma and 2.4 sigma) deviations. …
The strongest individual pulls toward smaller M_H are from M_W and A^0_LR …
A_LR was measured precisely by the SLD collaboration …
while A^(0,b)_FB and the NuTeV results favor high values …
the Z-pole forward-backward asymmetries at LEP … are given by A^(0,f)_FB … where f = e, mu, tau, b, c, s …
LEP 2 … Measurements were made … including … A_FB for b and c …
it appears that at least some of the problem in A^(0,b)_FB is experimental …
the uncertainty in A^(0,b)_FB is strongly statistics dominated. …
for … A^(b,c)_FB + M_Z …[gives]… M_H … 349 +250 -148 …[GeV]…
for … All data …[gives]… M_H … 89 +38 -28 …[GeV]…".
If the value of A^(0,b)_FB (pull toward high Higgs mass) were to be given more weight
the value of A^0_LR (pull toward low Higgs mass) were to be given less weight
would that give a Higgs mass more nearly in line with LEP II search results?
Since I am very naive about all these things, I will ask
whether the fact that LEP measured A^(0,b)_FB whose value is a pull that "favor[s] high values" of M_H
is related to the line in table 10.7 of the 2006 PDG Review:
"for … LEP 1 (no m_t) …[gives]… M_H … 168 +232 -91 …[GeV]…" ?
whether the fact that SLD measured A_LR whose value is one of the "strongest individual pulls toward smaller M_H"
is related to the line in table 10.7 of the 2006 PDG Review:
"for … SLD + M_Z …[gives]… M_H … 28 +26 -16 …[GeV]…" ?
Also, I note that the 2006 PDG Review says:
"… The forward-backward asymmetry, A_FB, for e+ e- final states in ppbar collisions has been measured by CDF and a value of sbar_l^2 extracted … A^0,b)_FB … and the hadronic asymmetries are mainly sensitive to sbar_l^2 …",
another very naive question I have is
Tommaso Dorigo replied 24 January 2007:
"... I am in no position to discuss the subtleties of the A_fb measurements, of which I am sure there are readers of this post who are more knowledgeable than me. However, I can certainly say you are right about those two pulls in opposite directions by LEP and SLD are measured in strength by the fact that if used alone in the fits they produce quite different values of the higgs mass. The relative strength of these pulls is, very simply, measurable by the distance between the higgs mass they predict with that of global fits (eg. 28 vs 80, 168 vs 80) and their uncertainty. The SLD measurement is indeed suspicious if exposed bare as the PDG does in the line you mention.
As for Nutev, their measurement is indeed quite off the mark, but I think that taking it away from the soup "because it is unlikely" subtracts information illegitimately. If included, the higgs mass magically grows by quite a bit… but the inclusions pays the price of a bad agreement with other measurements, so the "global" chisquare worsens significantly. I do not know by how much, unfortunately, since the blue band plot hides that information as far as I recall.
I will add that CDF measures the W mass high, but the pull in the global fit is not large. It is much larger the pull due to small top masses, and here let me be a bit suspicious, because my insider information happens to indicate that our jets are measured slightly low - by maybe a couple of GeV in the top decay range - and once that is taken into account, the top mass measurements increase by a little bit, enough to make the higgs rise also a bit. I cannot be more precise, since the b-jet energy scale measurement is not blessed yet, but it will be so in a few weeks, so stay tuned!
As for ppbar measurements of A_fb, I need to look those up! ...".
Tommaso Dorigo, in his blog entry "A 2.1 sigma eccess of MSSM Higgs!" said, on 19 January 2007:
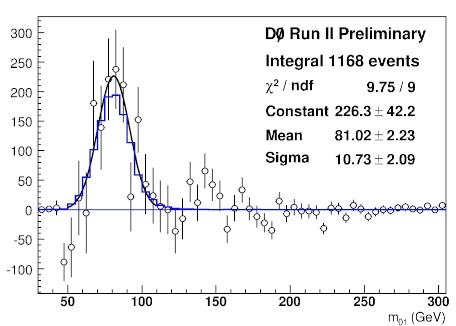
"... let me dig out a plot from D0, showing their excess of Z->bb events. Remember, if the higgs is produced directly, it has a branching fraction to b-quark pairs, and should be present as an excess in a plot such as D0's, albeit in modicum quantities. Here you can see the recent D0 plot.
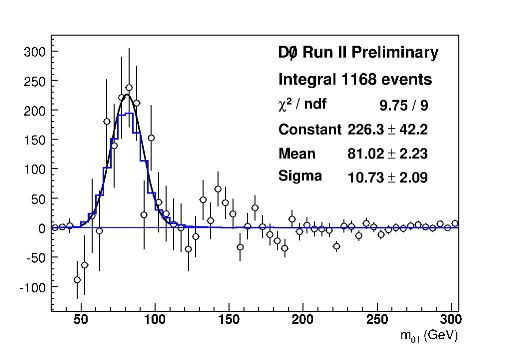
Interesting! They have an excess at 160 GeV above QCD backgrounds (which are subtracted in this plot). I wonder if D0 is considering the use of that plot - or better, an updated, larger-statistics version of it - for setting limits on ... higgs bosons, or claiming a signal!
My question is not irrelevant, although slightly half-joking as is my usual style. Indeed, Julien and I are just about to bless our own Z->bb signal, based on half an inverse femtobarn of data. Of course I cannot show you the plot, but guess what ? We also see a bump at 160 GeV!
I got you curious, didn't I ? You will have to wait for three more weeks to see the Z->bb plot by CDF, unfortunately! ...".
I [Tony Smith] was indeed curious, and commented on 24 January 2007:
"... Lubos Motl in his blog on 23 January 2007 says about what looks like the same D0 plot shown in this blog entry:
"… I [Lubos] am unconvinced by the statement that there is an extra bump at 160 GeV in the chart above. The chart would be more likely to indicate a bump at 140 GeV. …".
Although the statistics are very inconclusive to say the least, it seems to me that Lubos's remark is correct. I am not disinterested, because my model (non-supersymmetric) has a Higgs at about 146 GeV. ...".
Tommaso Dorigo replied 24 January 2007:
"... if you look at D0's plot, the Z peaks at 80, not 91 GeV.
That means that b-jets were not corrected for the many effects that make them different from generic jets (on which jet energy corrections are tuned, since those are the jets you get when you trigger on them at a hadron collider).
b-jets are indeed different: they have a harder fragmentation function, have a larger mass, but most of all they have a 23% branching ratio into leptons - so neutrinos are produced, and they do not leave a signal. Also, 13% of b-jets have muons inside, from b->mu or b->c->mu or b->tau->mu decay chains. And muons, too, give a minimum-ionizing response in the calorimeter.
All that to say that if the Z peaks at 80 instead than 91, then a bump at 140 means a particle at 160 GeV. ...".
Also on 24 January 2007 I commented:
"... thanks for explaining about the Z-peak being at 80 GeV indicating that the analysis that produced the chart was uncorrected for b-jet missing energy, so that the Z-peak showing up at 80 GeV when the Z-mass is known to be 91 GeV means that the Z-peak should be corrected by shifting it up 11 GeV to 91 GeV.
As you say "… then a bump at 140 means a particle at 160 GeV …".
Since my model value of 146 GeV Higgs is a tree-level calculation, and
since the state of uncertainty is such that it is OK to say that 140 + 11 = 160 GeV (and the 140 only comes from eyeballing a preliminary chart),
I am with respect to my model happy to see a bump around 160 GeV, and am looking forward to the CDF Z to bb plot to be released next month.
Further, the shift up by 11 GeV also would shift a much smaller (just one data point a bit above the base line, but it and its neighbors do look like a peak) bump in the D0 chart around 170 GeV up to around 181 GeV, which is in the range where my model expects to see a second Higgs peak (the model having 3 peaks for both the Higgs and the Tquark).
Such things are very highly uncertain, but they give me (probably unwarranted, but it feels good anyway) optimism while waiting for LHC results. ...".
Still later on 24 January 2007 Tommaso commented:
"... I think you know me well enough to not be surprised if I am skeptical about three-bumped stuff. However, I keep it an open-ended issue until the LHC nails it. And I would be disrespectfully happy if you turned out to be even half right.
As for the statistical information in plots, however, I usually get even more skeptical, since I know how to run pseudoexperiments, and when you do it long enough you get to understand a simple fact: just about any background-subtracted plot will show structures such as those at which you hint above.
You of course realize that yourself when you say "such things are very highly uncertain"… Yes. The CDF Z->bb plot will have four times more statistics than the D0 one, and some structure above 100 GeV will still be present (I cannot tell you exactly what or where for fear of being kicked out by CDF), but they will fail to demonstrate anything… We really need LHC data here. ...".
I agree that LHC data is needed to be very confident about such structures, but my personal confidence,
while very low for a bump at 160 GeV only in the D0 Z -> bb plot (just one plot),
goes up a lot if I see an independent plot of the same thing, also showing a similar structure ( bump at 160 GeV ). ( Something like that happened in the 1990s when a D0 histogram showed 3 Tquark mass peaks similar to the 3 Tquark mass peaks in a CDF Tquark evidence histogram. )
Since Tommaso said (quoted above):
"... You will have to wait for three more weeks [ from 19 January 2007 to 9 February 2007 ] to see the Z->bb plot by CDF ... Of course I cannot [ before 9 February 2007 ] show you the plot, but guess what ?
I am, assuming that events due to 80+80 = 160 GeV Wpair have been taken into account in background calculations by D0 and CDF, optimistic (subject to confirmation or refutation by LHC) that:
It is interesting that in the energy region from weak boson masses (80 to 91 GeV) to Higgs VeV (252 GeV) there are three bands (particle masses are tree-level values calculated from my model, and so may differ a bit from experimental observations):
Central: 170 to 190 GeV - Tquark_central (175 GeV), Higgs_central (180 GeV), Z0 pair (180 GeV)
High: 220 to 260 GeV - Tquark_high (225 GeV), Higgs_high (240 GeV), W+Z0W- triple (252 GeV), Higgs VEV (252 GeV).
"... I have been searching for Z decays to b-quark pairs in proton-antiproton collider data for the last 11 years. Of course that was not the only thing I did research-wise in this long time span, but it has been some sort of trademark of my research activity. During my whole career I almost exclusively dealt with the reconstruction of particle decays in jet final states. I saw top quarks, W bosons, and Z bosons decays to jets -and in two cases, these were first-time observations. Let me describe what this is about in a few lines.
The heaviest known particles - W and Z bosons, plus of course the top quark, or the still-to-be-seen Higgs boson - can decay to quarks pairs (triplets, the top) carrying so much energy that the latter fragment into collimated streams of hadrons - particles themselves composed of quarks. Hadronic jets are complicated objects. Their efficient reconstruction and precise measurement in present-day experimental apparata is not trivial. And the measurement of the mass of the originating particle, which disintegrated to yield the quarks and eventually the jets we observe, is very challenging.
I begun my career as a particle physicist in 1992, when I started collaborating with a group of physicists in Padova that was looking for the decay of top quark pairs into six hadronic jets - a final state apparently doomed by a huge background of QCD processes. Despite skepticism from our collaborators, my group eventually found a signal of that decay (you can see the top quark decay contribution as a white area in the plot, best fitting the black points if added on top of the yellow distribution describing the background shape),
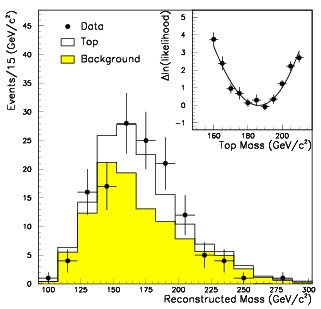
and in 1997 we published a "first observation" paper describing our result.
From 1996 to 1998, as a PhD student, I decided I would search for the decay of the Z boson to pairs of b-quark jets. As hard as finding six-jet decays of top-antitop pairs had been, this is even more difficult: you only have two jets in the event, and your background is more than 1000 times larger than the expected signal, and almost impossible to tell apart. In fact, at the outset most people in my collaboration believed I was wasting my time -a few experts had tried and failed before I even started. But I was confident in myself, and I also knew that finding Z->bb decays was of paramount importance: even failure would not be a waste of time! In fact, most of our hopes to find the Higgs boson at the Tevatron rely in the identification of its decay to pairs of b-quark jets, the very same final state of Z decay. And the Z is only slightly lighter than the Higgs is expected to be. But the Higgs has a much lower production rate! How, then, can we hope to see a Higgs if we do not first find the Z in the same final state ? Moreover, a well-defined Z signal allows one to tune the response of our detector to b-jets. We can test whether our jet energy is measured correctly, because we KNOW what the Z mass is (the LEP experiments measured it with extreme accuracy), and what we reconstruct in the detector can be brought to match that knowledge, improving our measurements with b-jets - the top quark mass, or the Higgs mass if the latter is found. Finally, the Z signal becomes a testing ground for any algorithm that attempts to increase the resolution of the b-jet energy - again, an issue of paramount importance in the search for the Higgs: if you are looking for a tiny little bump in a mass distribution, the better your resolution the higher your bump will stand on top of a flat background - so your discovery reach on the Higgs is a linear function of your energy resolution! In 1998 I blessed the result shown ...
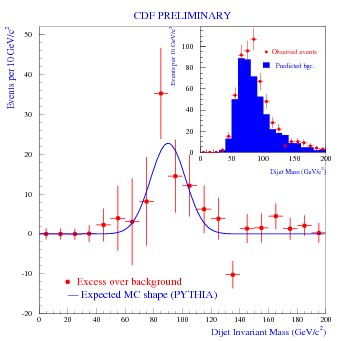
I found a small signal, about 90 events (you can see the excess of red points over the blue histogram in the inset, shown as a function of the reconstructed Z boson mass, and a background-subtracted distribution in the main plot): not altogether so significant by itself, but an important assertion about the capability of hadronic colliders to use that signal to learn how to measure b-jets and search for a light Higgs boson.
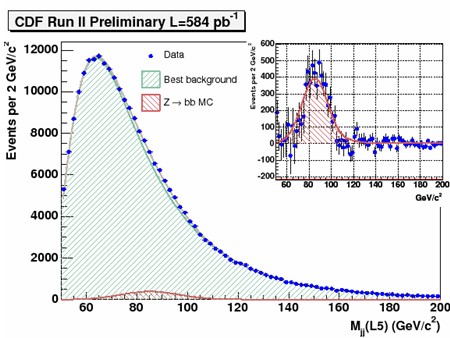
Then, in 2005 Julien and I, together with other members of a small, dedicated group were able to bless the "public-relation" plot shown here,
using four times more statistics and a much more efficient triggering procedure from Run II data. The green Z decay signal shown here amounts to about 3000 Z decays, but we did not use it in the determination of the b-jet energy scale, nor did we obtain a precise estimate of the production cross section.
Last year it was D0's turn to show what they could do in this department. They found a signal of about 1200 events ... see plot ...
but they did not venture in a full measurement of the energy scale or the Z cross section either.
Ok, that was the past. Now, in little less than two weeks, my work of ten years will reach a significant milestone. The search for Z bosons in CDF Run II data will be made public by CDF via what is called a formal "blessing" - an internal meeting where the results of a full-blown analysis are carefully scrutinized and approved for public consumption. After that happens, you will see here the new plots and the results we obtain. ...".
"... In a recent post I promised I would discuss the analysis by which the CDF collaboration (that is, Julien and me, in this case!) extracts a signal of Z decays to b-quark-jet pairs… So here it goes.
The process of Z production, followed by the decay of the weak Z boson to b-quark pairs, occurs roughly once every fifty million times at the Tevatron. This fact would not be disheartening by itself - signals a thousand times rarer can and have been isolated - were it not for the additional complication that the signature produced by two b-quarks emitted by the Z is really not very distinctive: a pair of back-to-back jets which contain hints of the decay of B-hadrons. The lack of tale-telling features capable of distinguishing the Z event from the 49,999,999 other collisions is the real trouble in extracting a Z&endash;>bb decay!
The CDF online data selection is a set of hardware devices that read in the detector output and decide in real time whether a proton-antiproton collision is worth writing to disk or not. While the collision rate is 3 millions per second, the storage system can only write to disk 100 events per second or so: a very selective filter, the trigger, takes care of picking the most interesting ones and discarding the rest. The search for Z->bb decays starts right there, at the trigger selection: to ensure that they get collected, the trigger must somehow recognize them.
An extraordinary device called the SVT takes care of precisely reconstructing the trajectories of charged tracks contained in jets in microseconds, allowing the trigger to select jet production events where b-quarks are likely to be present.
Due to the need of reducing the huge rate of QCD processes yielding b-quark jets in the final state as well as light-quark or gluon jets mistaken by the SVT as coming from b-quarks, the trigger selection kills 95% of our beloved events. We have to live with this, and be happy of the 5% we have a chance to study. (Note: QCD (quantum chromo-dynamics) processes are those mediated by the strong interaction. Most frequently, they consist in a high-energy scattering of two quarks or gluons off one another. The scattered bodies hadronize in a pair of back-to-back jets not unlike those from Z decay.)
The surviving events are reconstructed by an offline program, and then a further filtering starts: we need to get rid of as much background as we can, by relying on any conceivable characteristics able to discriminating Z production from QCD events.
The selection starts off by requiring both jets to contain a reconstructed secondary vertex. A secondary vertex is the originating point of two or more charged tracks contained in the jet cones, and it is the result of the long lifetime of the b-quark. The hadron containing the b-quark leaves the primary interaction point at little less than light speed, traveling as much as a few millimeters before disintegrating into the charged particles which allow to determine the decay point.
After the selection of an almost pure b-quark pair production final state, the signal-to-noise ratio is still very small: in the data analyzed by CDF, about 10,000 Z->bb events are contained in dataset of about a million events. But QCD events, produced by strong interactions, are different from Z production, due to weak interactions. The difference is that the Z can only be produced by the collision of two quarks - one from the proton and one from the antiproton-, while QCD events are mostly the result of a gluon-gluon collision -again, each coming from one of the two colliding bodies.
Gluons, the mediators of the strong force, have a higher color charge than quarks. They are thus more likely to radiate additional gluons. This is a difference that results in a higher fraction of three-jet events in QCD processes than in Z production processes. For the same reason, the two leading jets emitted from the Z decay are more likely to be back-to-back than jet pairs from QCD events.
A selection tuned to increase as much as possible the signal significance is thus performed on two kinematic variables: the angle between the two jets, which is required to be close to 3.14, and the transverse energy carried by the third jet in the event - if there is any. This allows the signal to noise ratio to become roughly 2% - a Z event every 50 QCD events.
Once you have done all you can to increase the signal significance, you have one last weapon - the most powerful one, which you saved for your advertising plot. It is the invariant mass of the dijet system: when the Z boson decays to two b-jets, it imparts them with energy equal to its rest mass. By measuring the energy of the two b-jets you can get back the 91 GeV of the Z mass, give or take some uncertainty due to the imprecise determination of jet energy. QCD events, on the other hand, are not the result of a massive particle decay: the reconstructed mass of b-jets from QCD processes is a smoothly falling distribution, whose shape reflects the selection cuts (requiring jets to have energy in excess of 20 GeV, say) and the decreasing probability of higher energy collsions.
The plot shown above is the final result of the analysis performed on early Run II data in 2005. The Z contribution extracted by a two-component fit is shown in green. You can see that it is a small fraction of the total data! Yet, its measurement carries some significance, because by comparing the result with simulations we learn how well we measure the jet energy in our detector.
In four days, Julien will bless the result of our analysis of new data - almost twice as much as the data shown in the plot above. From the Z signal we have successfully extracted a measurement of our b-jet energy scale, which carries an uncertainty as small as the best determination obtained so far with the W->jj signal in top pair production events.
So what is the big deal ? Well, this determination of the b-jet energy scale is the first ever obtained with b-quarks. The W signal allows to set the energy scale of light quark jets, which are potentially quite different. With this new measurement, the future top quark mass measurements at the Tevatron will sizably decrease their systematic uncertainty.
I will say something more when I will have permission to be more quantitative… After the blessing! ...".
"... Julien blessed our new result of a Z->bb signal from Run II CDF data.
We measure a signal of 5674+1540-725 events, and a b-Jet energy scale factor of 0.974+0.020-0.018. The latter is the most precise and only determination of this quantity so far. It basically tells us the amount of miscalibration of our jet energy corrections for b-jets.
Using the b-JES for the reduction of the top quark mass systematic uncertainty will require more work. ...
In the plot below, hot from the press, you see as blue points with tiny error bars the dijet mass distribution of experimental data after a tight selection aimed at increasing as much as possible the elusive Z signal. The black curve is the fit, the fitted Z signal is in red, and the QCD background is in green. In the inset you see the excess of data over the background alone, compared to the fitted Z signal. ...
 ...".
...".
......