In comments on a 5 September 2007 entry in Tommaso Dorigo's
blog:
I said: "... in the ... plot ...
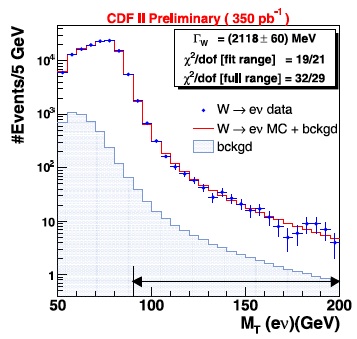
[from Tommaso Dorigo's]... PASCOS 2007 talk ... there
seems to be a bump in the W to e nu data for M_T around 170 GeV,
which is the CDF accepted Tquark mass and the mass of the middle
state in my 3-state Tquark model.
It also seems to me that there is a smaller bump around 130
GeV, which is the Tquark mass for the low state in my 3-state
Tquark model.
Note that the ... plot ... does not go above 200 GeV, but in
...[another plot in that paper]... (both for 1-tagged and
2-tagged)
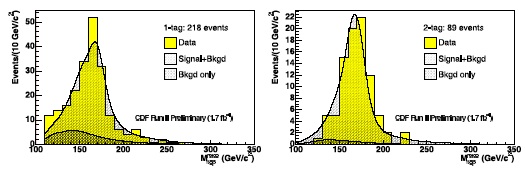
it seems to me that there is a small peak around 220 GeV, which
is the Tquark mass for the high state in my 3-state Tquark
model.
Tommaso Dorigo replied:
"... I honestly do not see the bumps you mention - I
think they are quite reasonable fluctuations up and down in the
spectra, especially in the top mass plot where stats are poor. In
any case, the W sample is really devoid of contaminations from top
decays, because of the selection cuts applied to clean up the
sample - among them, a jet veto. ...".
I then asked:
"... What if I wanted to see whether such Tquark bumps
might exist, and so wanted to look at the sample without the
Tquark suppressing selection cuts ?
How much trouble would it be for CDF to do such an analysis
?
Would CDF provide access to the sample data without such cuts
to an outside analyst ? ..".
Tommaso Dorigo replied:
"... a search for a top quark of 140 GeV or elsewhere was
done - when the top had not been found yet. However, I admit that,
once it was found conclusively at 174 GeV, people stopped looking
elsewhere. In any case, the background modeling has now reached a
precision which leaves little margin for other resonances, but
admittedly one never knows, at least until a limit is extracted
directly. One could say that the xs limits obtained until 1993
still apply though. If your t quark at 140 and its other
instantiations at higher masses are predicted to have lower cross
sections, they might as well be still allowed, considering some of
the backgrounds are tuned using the data (and if some unknown
signal is buried therein, it may therefore get washed away).
Doing such a search is tough because no grad student would be
willing to waste his time on setting a limit (few would truly
believe the top at 140 or 190 is there) and then being unable to
publish it -
the theoretical motivation for the search is wanting, given the
lack of any publication in support.
Yes, this is the trouble with mainstream physics.
There is no way you can get your hands on CDF or D0 run II data
other than associating to somebody willing to do the analysis.
When I did a search for associated VY production in 2001-2003,
there was a chinese physicist from Berkeley who participated, and
eventually he was accepted as co-author of the paper I wrote,
although he always claimed he had seen a signal (I set a limit on
the process).
D0 data from Run I is, however, public, or so I am told.
However, it is tough to make anything of it without a detailed
understanding of the detector, the data acquisition, and suitable
monte carlo simulations. ...".
I then said:
"... there will never be a "publication in support" of my
model because of blacklisting,
even though it is a model in which the Higgs as a TTbar
condensate leads naturally to the Tquark, through variants of NJL
models (work of Yamawaki et al), being not a simple single-state
system like lighter quarks, but with mass states including around
140 GeV and 174 GeV. ...
about old CDF and D0 semileptonic histograms:
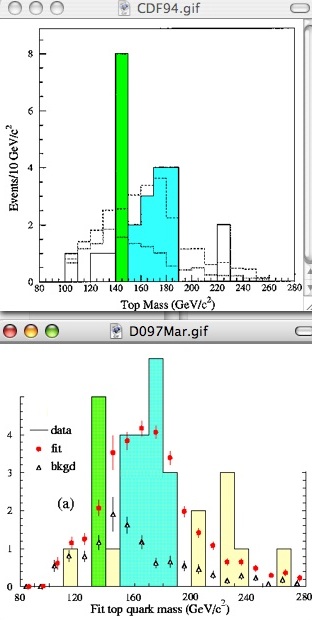
With respect to the CDF figure ... (colored by me with
blue for the peak around 174 GeV) ... do you agree with CDF that
the green peak around 140 GeV is "a statistical fluctuation" ?
With respect to the D0 figure ... (colored by me with blue for
the peak around 174 GeV) ... do you think that its green peak
around 140 GeV is also a statistical fluctuation ?
If they are both statistical fluctuations, then what are the
odds of such large fluctuations showing up at the same energy
level in two totally independent sets of data ? ...
Tommaso Dorigo replied:
"... As for the two plots you mention, they show single
bin fluctuations at 140 GeV. I read 8 events in the CDF one, in
the face of a background plus signal totalling probably 2.5, and 5
in the D0 one, with about 2 from bgr+"standard" ttbar. You ask
what is the probability of such a fluctuation, and that I can
answer.
It is of the order of 4-sigma.
[ To parapharse Tommaso Dorigo, in his 11 October 2007 blog
entry "Single top: new results from CDF!":
WHATSA 4-SIGMA ?
In that blog entry, Tommaso Dorigo explained, saying:
"... To make a simple example, suppose you count events with
certain characteristics in a given dataset, expecting to see 100 from
known background sources. You see 130: that is a surplus of +30
events, which is unlikely to be due to a fluctuation in the sample
size. Usually, event counts follow Poisson statistics, which
basically says that the variance of the 100 events is nothing else
than , i.e. 10. A Poisson distribution centered at 100 with a width
of 10 is basically a gaussian function, which dies out quickly as you
move away from 100 on either side. How quickly ? Well, you expect 68%
of the distribution to be contained in the [90,110] interval
- "1-sigma"; 97% to be within [80-120] - "2-sigma"; and 99.7%
to be within [70-130] - a "three-sigma" inteval. ... a
"three-sigma" or larger effect is usually called "evidence" by
particle physicists looking for a particle decay signal. It means
the data really fights with the interpretation of containing only
background processes you have already accounted for when you
estimated your central value (100 in the case above). A separate word
is reserved for "five-sigma" effects, which are a really tiny
probability of being due to accidental background fluctuations: in
that case the effect is called "observation" of the sought particle.
...".]
However, one would be entitled to claim a 4-sigma effect
only if one observed the data after predicting the location of the
excess beforehand. In other words, a 13-over-4.5 event excess is
less significant if it is allowed to sit anywhere in a plot.
But maybe you had predicted the top at 140 before the CDF plot
of 1994 came out, so that is not a concern.
My own concern as an experimentalist is that such a spike is
not physical, given the mass resolution of CDF and D0 on a top
quark decay. The top has a resolution of about 25 GeV, so in any
one 10 GeV bin there cannot be more than 20% or so of the total.
That spike may be very unlikely as a fluctuation, but it is even
more so as a signal.
To be clear, there can be no effect that makes a signal
significantly narrower than what it is expected. One would have to
hypothesize that all jets in those events fluctuated to neutral
pions (measured better), and still the resolution would be far,
far larger than the 5-10 GeV necessary to at least hope that a
significant portion of the signal falls in a single bin. ...".
I then said:
"... Claudio Campagnari and Melissa Franklin said in
hep-ex/9608003 "The Discovery of the Top Quark": "… The
energy of a jet … resolution … is typically only of the
order … 1.0 / sqrt(ET) (ET in GeV) … This poor
resolution is due to
- (i) the intrinsic large fluctuations in the response of
calorimeters to hadronic showers,
- (ii) differences in the calorimeter response between
charged hadrons and electrons or photons,
- (iii) energy loss in uninstrumented calorimeter regions
…
- (iv) energy loss due to the use of a finite cone-size in
jet reconstruction, and
- (v) overlaps between the jet and hadrons from the
underlying event …".
Their figure 32
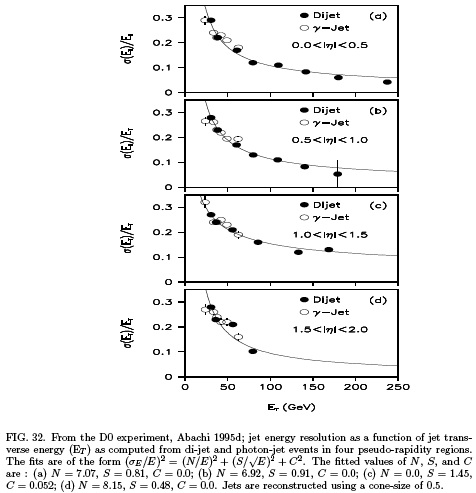
shows, for D0, "… jet energy resolution as a function of
jet transverse energy (ET) …",and it shows resolution ranging
from about 0.25 for ET around 30 GeV to about 0.1 for ET around 70
GeV or above, which is pretty much what you said.
However, it seems to me that the consistency of the two plots I
mentioned in that they both show narrow 10-GeV peaks around 140
GeV might indicate that the CDF and D0 detectors might really in
fact have had somewhat better resolution.
Is it possible that, in an effort to be very conservative and
absolutely certain that the Tquark discovery claim be ironclad,
the resolution could in fact have been better than they stated ?
...".
On 11 October 2007, Tommaso Dorigo posted a blog entry "Single
top: new results from CDF!" in which he said:
"... … New technologies and more confidence in the
Monte Carlo simulations of signal and background processes allow
much more refined techniques. In the new and very successful CDF
analysis, authored by … Florencia Canelli (now FNAL),
together with Peter Dong, Rainer Wallny, and Bernd Stelzer (all
from UCLA) … use is made of the matrix element of the sought
process ...
single top events ... amount... to a cross section sigma(t) =
3.0^{+1.2}_{-1.1} pb ... From this measurement, it is
straightforward to derive a measurement of the
Cabibbo-Kobayashi-Maskawa matrix element , a number that specifies
how likely it is that a W boson couple to a t and a b quark line.
The cross section for single top production is in fact
proportional to the square of that element. CDF finds V_tb = 1.02
+/- 0.18 +/- 0.07, where the second uncertainty is theoretical and
it arises from the uncertainty in top cross section dependence on
top quark mass, and other modeling details (fragmentation and
renormalization scales, alpha_s value). ...
Tony Smith, in a comment below, asks for the distribution of
reconstructed top quark mass of candidate events with a high value
of EDT, a plot which last year caused some discussion
(echoed for the D0 analysis), given that it showed some
excess at 140 GeV which could fit Tony's hypothesis of a top quark
at that mass value. Here is the updated plot:
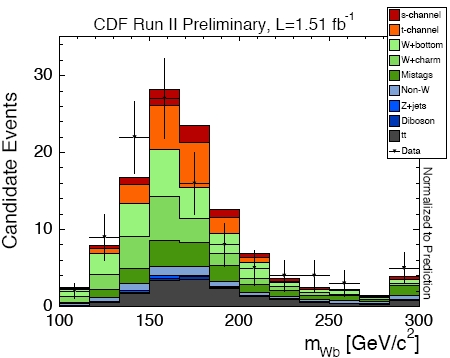
For a ghost signal, I must say this 140 GeV top quark issue is
hard to die… One bin up, one bin down, and there still is
something to talk about! And it all started about 15 years
ago… For more information you can read some details of the
analysis in the conference
note of the analysis. ...".
In my comment to which Tommaso Dorigo referred above, I said:
"... Tommaso said "… New technologies and more
confidence in the Monte Carlo simulations of signal and background
processes allow much more refined techniques. In the new and very
successful CDF analysis, authored by … Florencia Canelli (now
FNAL), together with Peter Dong, Rainer Wallny, and Bernd Stelzer
(all from UCLA) … use is made of the matrix element of the
sought process …".
Isn't this the same group that last year "… performed the
first search for single top using a Matrix-Element based analysis
…" with a result that Tommaso said in a 20 November 2006 blog
post "… does measure a meaningful cross section - but a part
of the excess of signal events clusters at low mass, indeed
…" ?
- If so, does their new result also have "a part of the
excess of signal events [that] clusters at low
mass"?
- Are they using basically the same Matrix Element technique,
and if not, what are the significant differences?
- Do they have sensitivity charts (plotted as Events v. Mass)
for increasing cuts on the Event Probability Discriminant, as
they had last year?
- If so, are they available on the web? ...
PS - Wasn't a competing Likelihood Function method also used
last year by CDF, with a result that it found no events, thus
disagreeing with the Standard Model?
Are there any newer results from the CDF Likelihood Function
people?
Tommaso replied:
"... I partly answered you in an update of the post. As
for the likelihood, I will report on that too in due time - but it
was not "disagreeing with the SM", it was a 2-sigma-ish downward
fluke to me. ...".
I then said:
"... Tommaso, thanks for the update and the link to the
pdf file.
As to the Likelihood Method, sorry for using the language
"disagreeing with the SM", when a direct quote from your November
2006 blog entry, with more context, is:
"… CDF can not measure the production of single
top yet, and actually is in the awkward position of excluding
its production according to the predictions of the Standard
Model. … Nobody really believes that single top production
is not there: it must be. It probably is just a unlucky
downward fluctuation of our data. But still, it starts to be
embarassing! …".
I am looking forward to your "in due time" report about any new
Likelihood Method results at CDF. ...".
Tommaso replied:
"... Hi Tony, it's tough to argue with people who quote
you : |)
Anyway, I will let you know soon about the likelihood, I think
there is a blessed result out on that too. ...".
The "conference
note of the analysis" mentioned by Tommaso Dorigo contains not
only the figure shown above that "... includes the last three bins of
the EPD discriminant (EPD > 0.9) ..." but also this figure
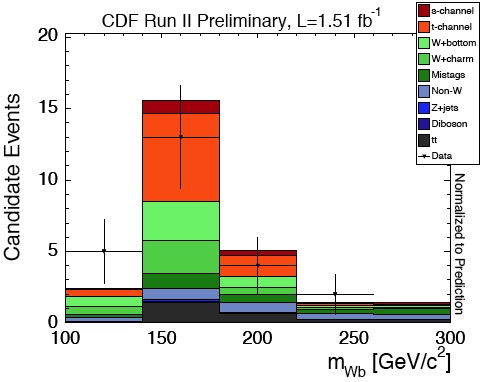
that "... incliudes the last bin of the EPD discriminant (EPD >
0.966) ...".
So, it seems that the new 2007 CDF Matrix Element
analysis still shows "a part of the excess of signal events
[that] clusters at low mass", and, as Tommaso Dorigo
said,
"... this 140 GeV top quark issue is hard to die…
And it all started about 15 years ago…".
Even though over 10 years ago it appeared to have 4-sigma
significance in CDF and D0 Tquark event histograms, and has appeared
repeatedly in Fermilab data since then (up to and including the
updated analyses described on this web page), I have been blacklisted
from posting such ideas on the Cornell arXiv,
and it seems unlikely that detailed search for the truth
about the Truth Quark will be undertaken with respect to CDF or D0
Run II data, or LHC data, because, as Tommaso Dorigo said
above,
"... the theoretical motivation for the search is
wanting, given the lack of any publication in support
..."
and
the Cornell arXiv blacklisting prevents any publication
of my theoretical model that would support the search.
Such a Catch-22 situation is frustrating to me, as is the
Kafka-esque blacklisting of me by the Cornell arXiv, with respect to
which they said that I am in "... a large pool here ... typically
flagged by reader complaints ...", but refuse to
tell me who has complained about me, or
tell me exactly what complaint they have about me, or
give me a reasonable opportunity to reply to any such
complaints.
Tony
Smith's Home Page
......